

4Q MARKET OUTLOOK
Navigating the AI Supercycle – Strong Tailwinds, Thinner Air
By: OpenArc Investments
Navigating the AI Supercycle – Strong Tailwinds, Thinner Air
4Q 2025
MARKET STANDOUTS AND LAGGARDS
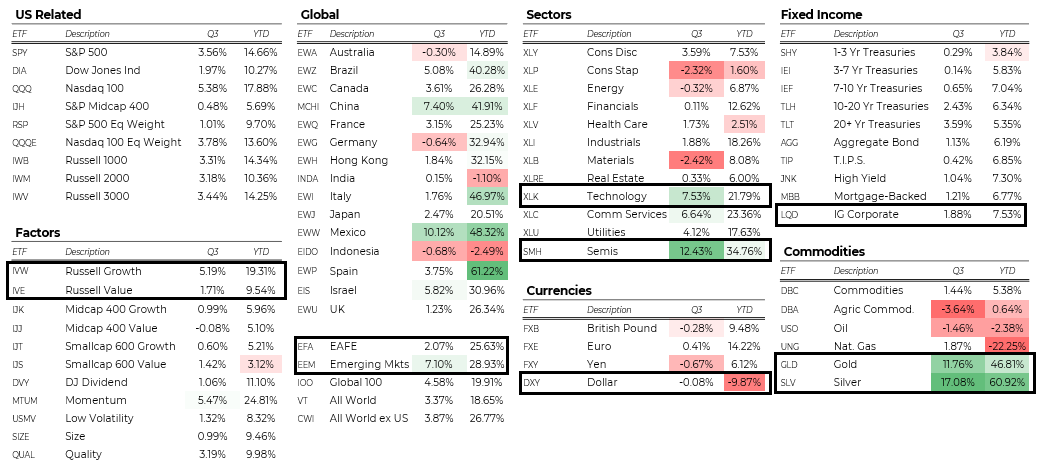
Source: YCharts, as of 9/30/25
THE OPENARC MARKET OUTLOOK
3Q Setup:
- 4 prices (USD, oil, rates, credit spreads) all being pressed lower with the administration guiding constructively thus far
- Don’t Fight
the FedTrump - Market rally led by Semis, AI, and Power, bolstered by administration support
- AI momentum – AI capex helped drive the mania, and the market is picking winners
- Earnings stayed strong through the summer, especially in the US
Key Questions:
- Where are we in the AI supercycle?
- Gold is on a tear – what is that signal telling us?
- Why aren’t bonds pricing in more volatility?
Our View:
- Long the “Power Shortfall” using active – the US is structurally short power, and demand is increasing significantly
- Long AI using active – dispersion within AI is picking up, we think the market will continue to pick winners and losers
- Long Defense – starting with fiscal in Europe and bolstered by OBBBA in the US
- Long Financials – think the steepening yield curve and deregulation should be beneficial for financials going forward
We are responsibly bullish into year-end, but laser focused on what could go wrong.
3Q SETUP
OPENARC “FOUR PRICES” SIGNAL RISK ON:
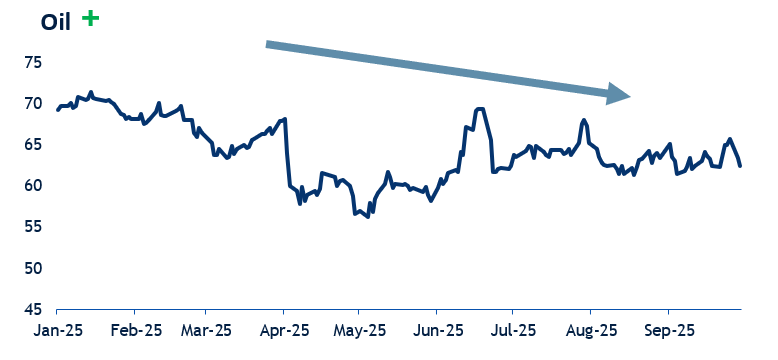
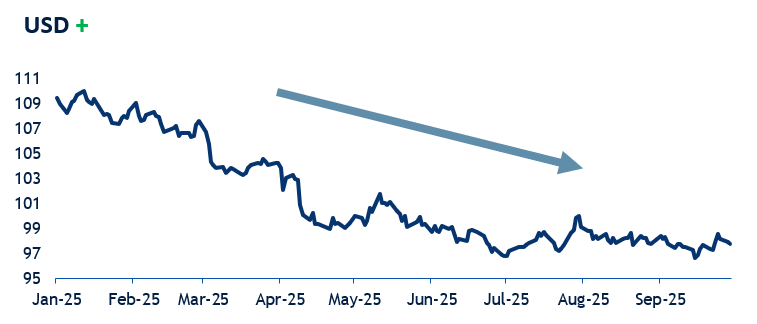
The Trump administration is actively pushing three of the four key prices we monitor – oil, the US dollar, and interest rates – lower, creating a constructive backdrop for risk assets. We remain responsibly bullish and are closely monitoring these indicators, as any reversal could signal a broader need to reassess our risk posture.
Source: Bloomberg, as of 9/30/25
DON’T FIGHT THE FED TRUMP
The “invisible hand” of the Trump government is visible
“To The Department of Energy: DRILL, BABY, DRILL!!! And I mean NOW!!!” – @RealDonaldTrump, 06/23/25
“Even more importantly, LOWER INTEREST RATES!” – @WhiteHouse 07/24/25
“America is the country that started the AI race. And as President of the United States, I’m here today to declare that America is going to win it” – @WhiteHouse, 07/24/25
“Under my administration, we will maintain necessary protections for our national security, but we will never forget that the greatest threat of all is to forfeit the race [for AI] and force our partners into rival technology. We’re not going to do that.” – Trump, 07/29/25
Source: Bloomberg, as of 10/10/2025
MARKET RALLY LED BY AI, SEMIS, AND POWER
Market performance continues to be driven by performance of companies engrained in or adjacent to AI.
Semis, AI, and power are leading the way higher as optimism surrounding the future of AI provided robust support to the market.
Washington isn’t just talking—it’s investing. Semiconductors, AI, and power infrastructure are leading the market as the administration’s commitment to American AI dominance creates a powerful tailwind.
Source: Bespoke, as of 09/30/25
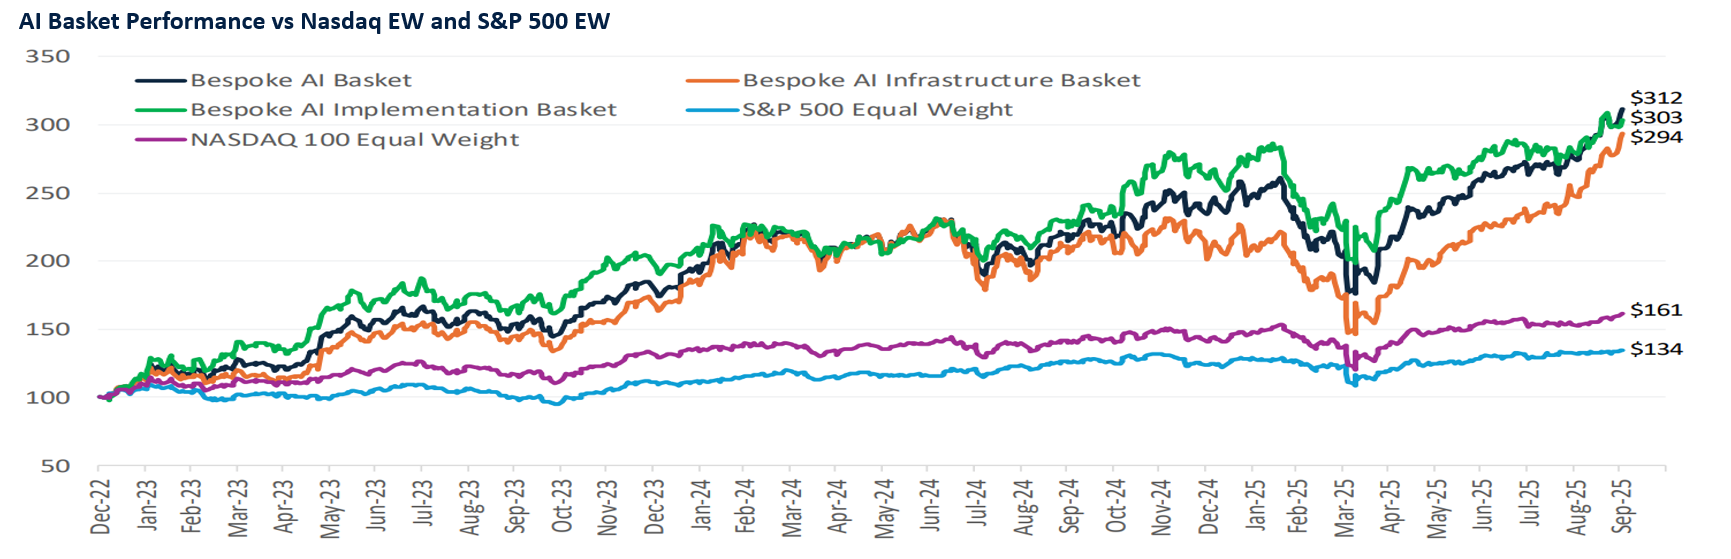
AI MOMENTUM – MAG 7 DISPERSION 7 CAPEX DRIVING GAINS
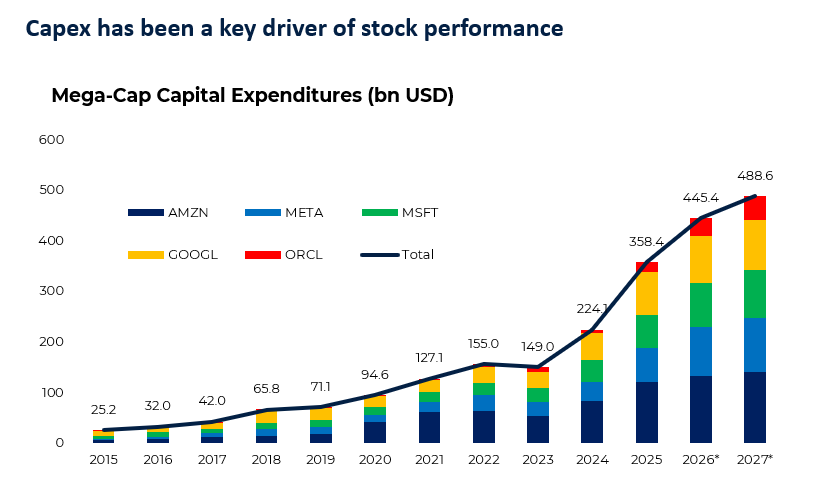
The market is rewarding companies spending on AI-related capex.
Over the past five years, tech exposure paid off broadly, but dispersion is accelerating as the market rewards winners and punishes losers on AI spend.
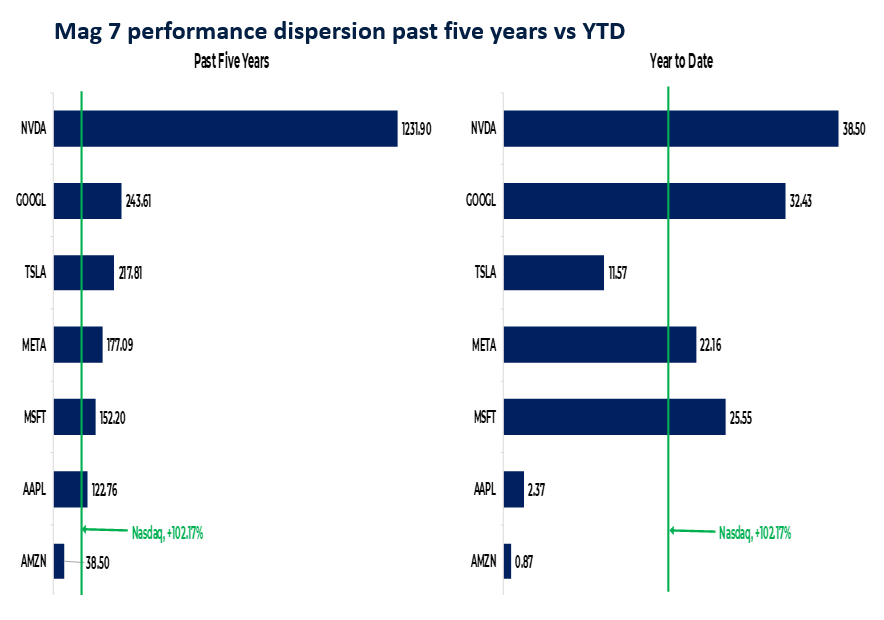
The market is violently picking winners and losers.
Within the Mag7, NVDA, GOOGL, MSFT, and META are clear winners, actively deploying significant capital toward AI buildout. Conversely, AAPL and AMZN are viewed as behind the curve, with lower AI-related capex.
Source: Bloomberg, YCharts, performance data as of 10/08/25
US EARNINGS STAYED STRONG THROUGH THE SUMMER
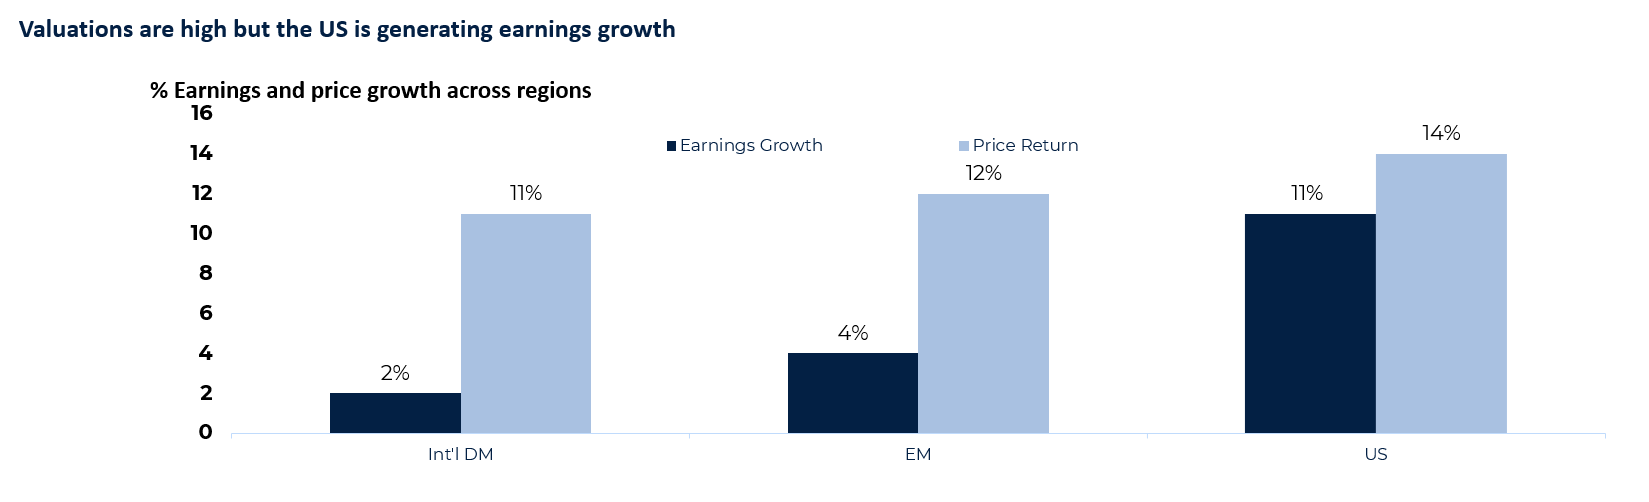
Valuations reflect real earnings strength.
Valuations have reached the upper end of their historical range, but strong company fundamentals are supporting these prices.
S&P 500 operating margins remain healthy and stable near multi-year highs, indicating operational efficiency and pricing power rather than just multiple expansion — a key difference from past market peaks.
Prior to the dot-com bubble, tech’s earnings weight increased by ~5%, while its market cap weight surged over 20%; today, that gap is much less extreme.
Source: Bespoke, as of 09/30/25
KEY QUESTIONS
WHERE ARE WE IN THE AI SUPERCYCLE?
Three reasons we think we are in the early innings of the AI buildout
1. Growing Ecosystem
Slowly expanding circle of participants beyond the current major players.
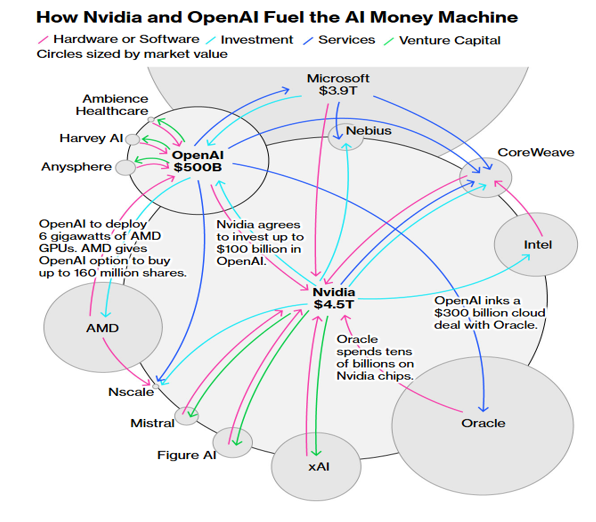
2. Significant Investment
Massive infrastructure investment from leading AI players.
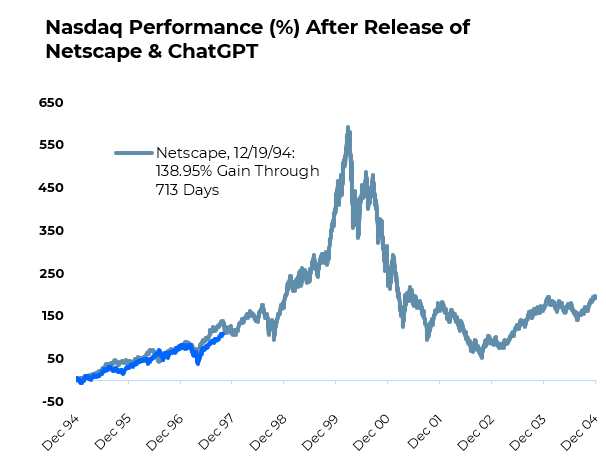
3. Increasing Adoption
Rapid but incomplete adoption, leaving significant runway for growth.
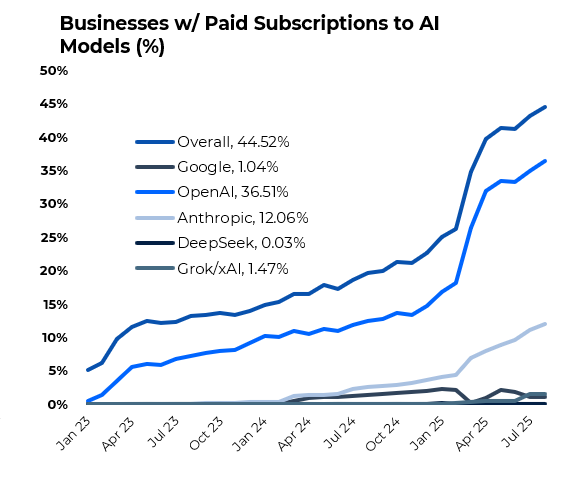
Source: Bloomberg, Bespoke, as of 10/10/25
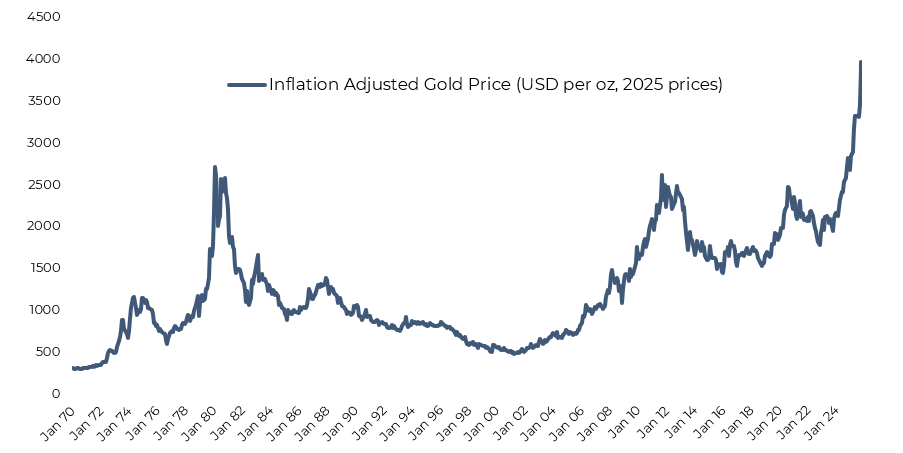
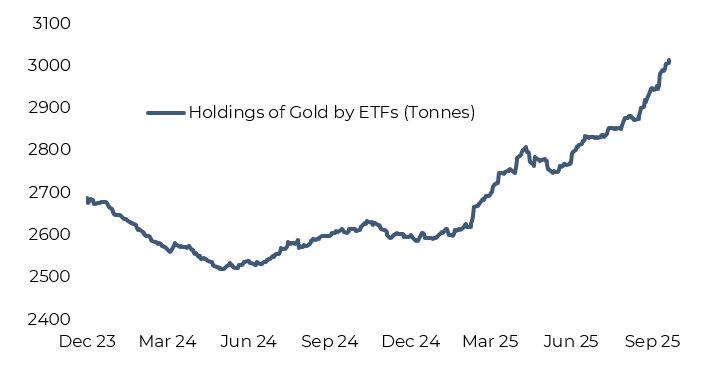
GOLD IS ON A TEAR – WHAT IS THAT SIGNAL TELLING US?
Gold’s powerful rally continues
ETF buyers of gold
Allocation of total global FX reserves (%)
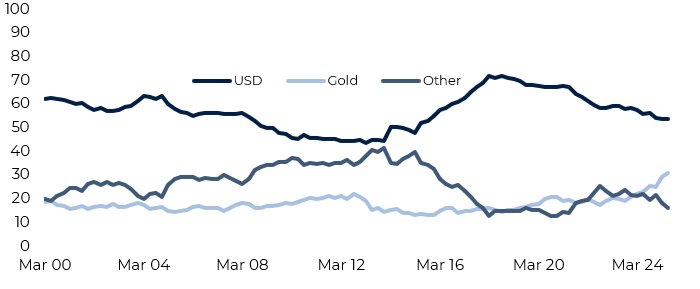
- New market participants: ETFs and retail buyers are adding incremental demand
- Global central bank buying: Central banks continue to shift reserves away from the US dollar as a hedge against ongoing deglobalization
- Large U.S. fiscal deficits: Portfolios are increasingly turning to gold for protection
Source: Bloomberg, Bespoke, as of 10/10/25
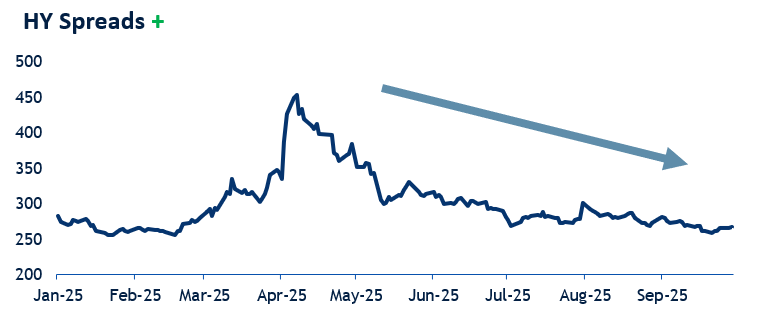
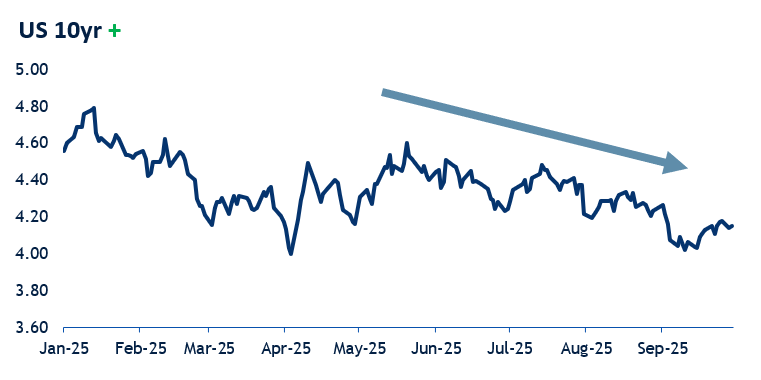
WHY AREN’T BONDS PRICING IN MORE VOLATILITY?
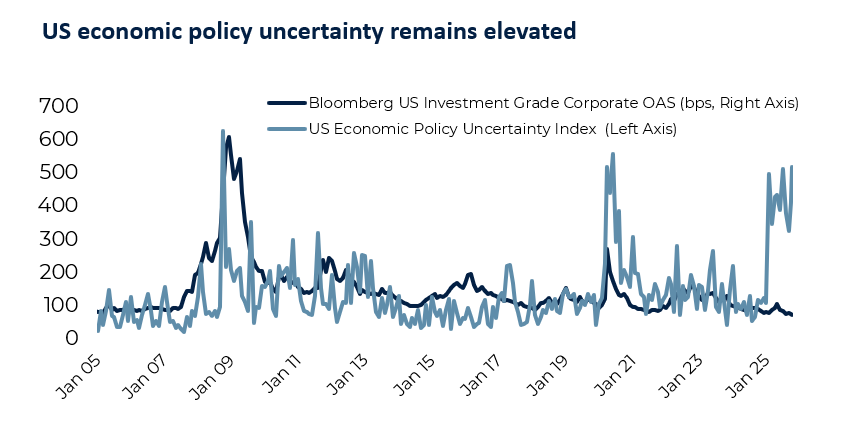
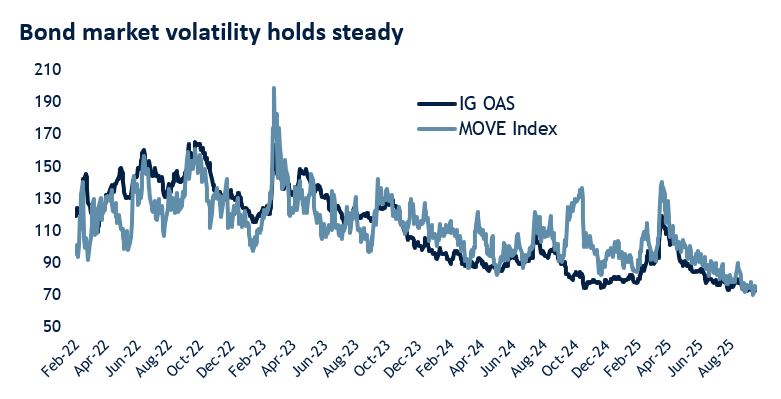
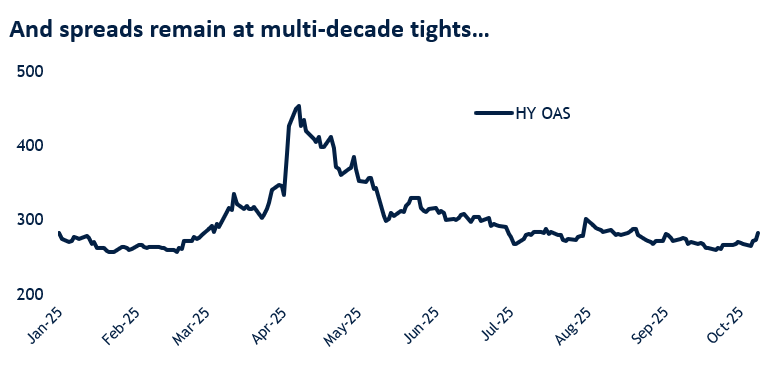
Corporate bonds have been immune to economic policy uncertainty.
Corporate fundamentals remain solid, supported by a favorable economic backdrop and healthy balance sheets with manageable leverage. While pockets of stress exist within credit markets, overall conditions remain stable. Despite elevated policy uncertainty under the Trump administration, rate volatility has stayed contained – providing a firm foundation for corporate bond spreads to remain tight.
Source: Bloomberg, Bespoke, as of 10/10/25
OUR VIEW
THE US IS STRUCTURALLY SHORT POWER
View 1: Long this structural shortfall using active
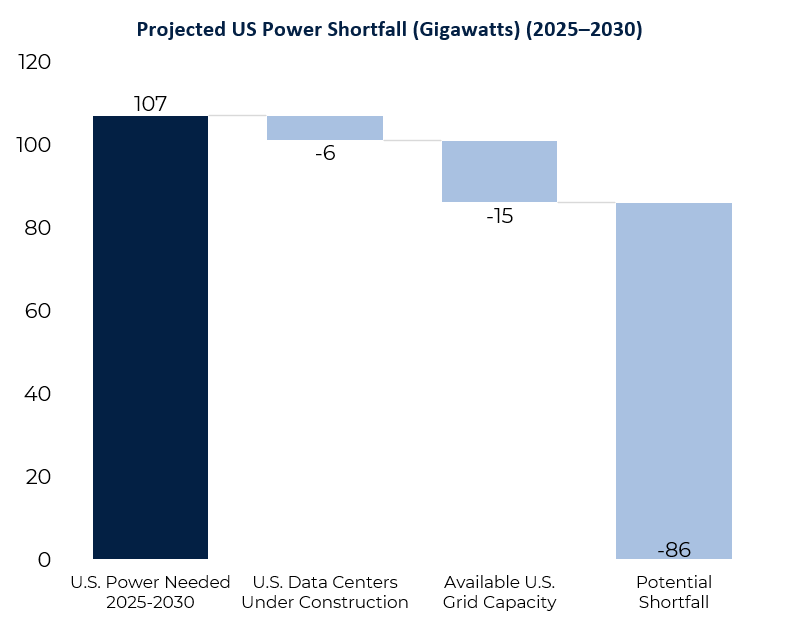
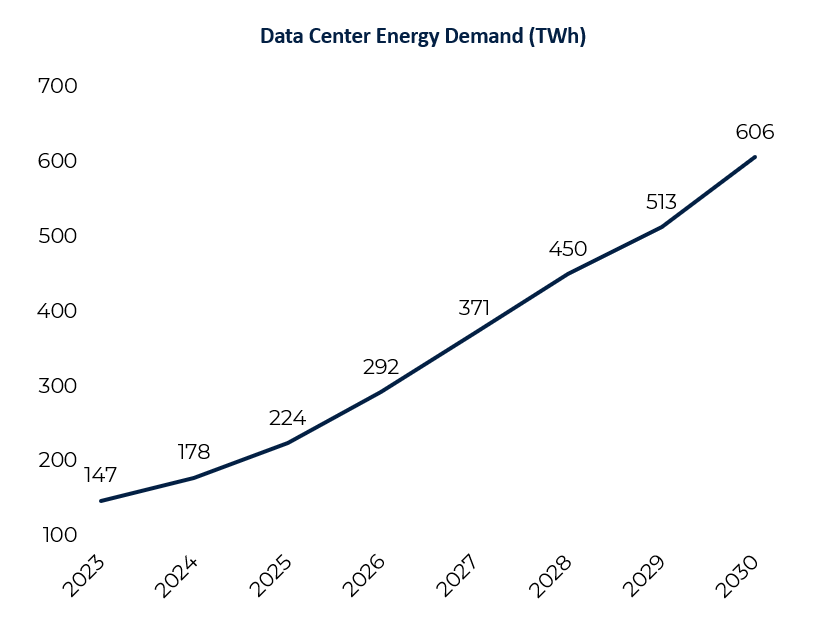
The US remains critically underdeveloped to provide for the growing power generation demands of the AI supercycle, as well as everyday consumption. We continue to see significant capital investment directed toward expanding generation capacity, including initiatives supported by the US government. We believe this theme offers considerable upside potential, and we are leveraging active managers to capture these opportunities.
Sources: TCW Transform Systems ETF Presentation, 09/30/25
TECHNOLOGY – MORE WINNERS AND LOSERS
View 2: Responsibly long AI supercycle use active
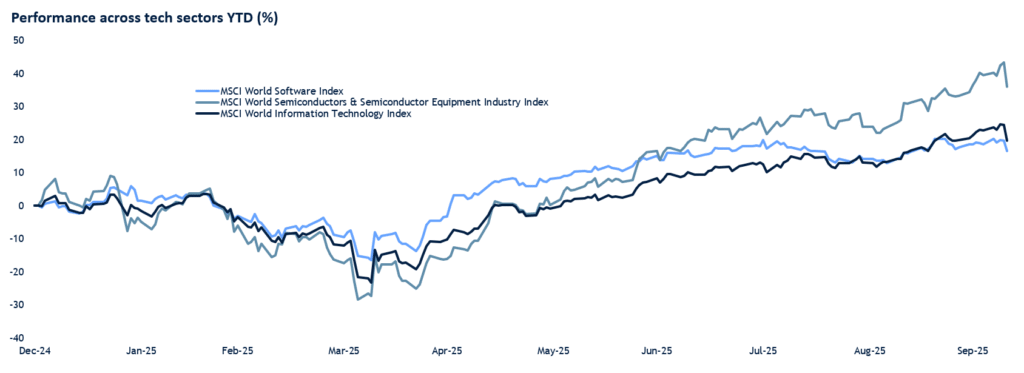
We believe the AI supercycle will continue to create clear winners and losers, consistent with the trends observed year-to-date. As illustrated in the chart above, there is substantial performance dispersion between the “haves” and “have-nots” across broad-based technology. Our goal is to capture as many winners as possible while avoiding underperformers, which is why we favor active management over passive beta exposure for this theme.
Source: Bloomberg, as of 10/10/25
AEROSPACE AND DEFENSE – FOLLOW THE MONEY
View 3: Long defense due to the increase in fiscal spend from OBBBA
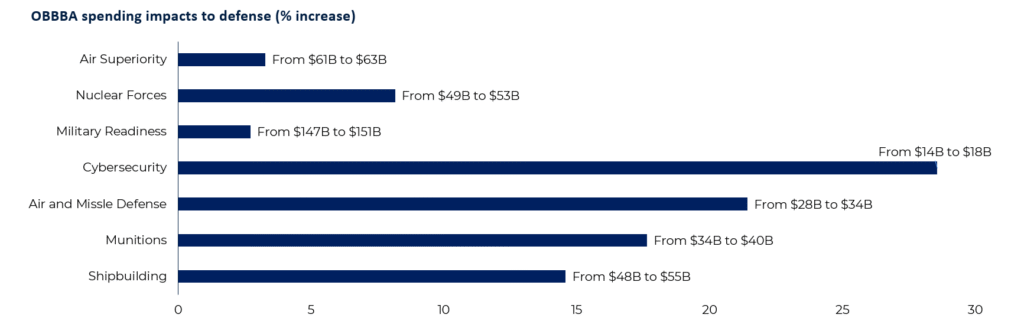
Geopolitical shifts, supply chain restructuring, new trade barriers, and competition for critical technologies are accelerating investment in national security and resilience – creating a theme we believe will drive performance across the defense stack.
While the US leads through the OBBBA, global defense spending reached a record $2.7 trillion in 2024, providing multi-year revenue tailwinds for industrial companies throughout the defense supply chain. We favor allocating to this theme, confident that fiscal support will translate into performance.
Source: BlackRock, BCA
FINANCIALS SHOULD BENEFIT
View 4: Long financials for steeper yield curve, less regulations, and more deal flow
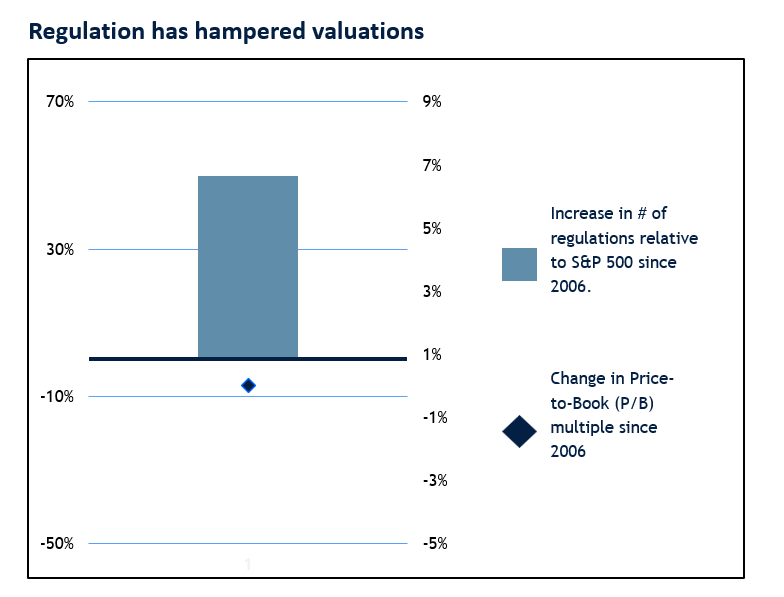
Bank-Friendly Administration: Regulatory conditions are easing.
Net Interest Margins: Profits likely to expand with a steeper curve, as banks lend long and borrow short.
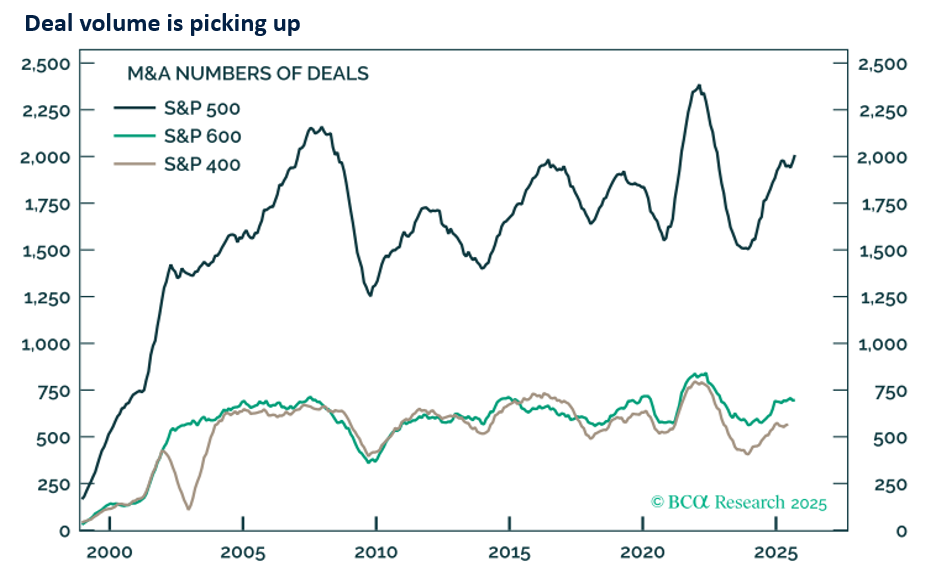
Capital Markets are Rebounding: M&A and IPO activity are picking up, driving stronger earnings for financials. As corporate confidence builds, we expect this trend to gain further momentum.
Source: BCA, Bespoke, as of 09/30/25
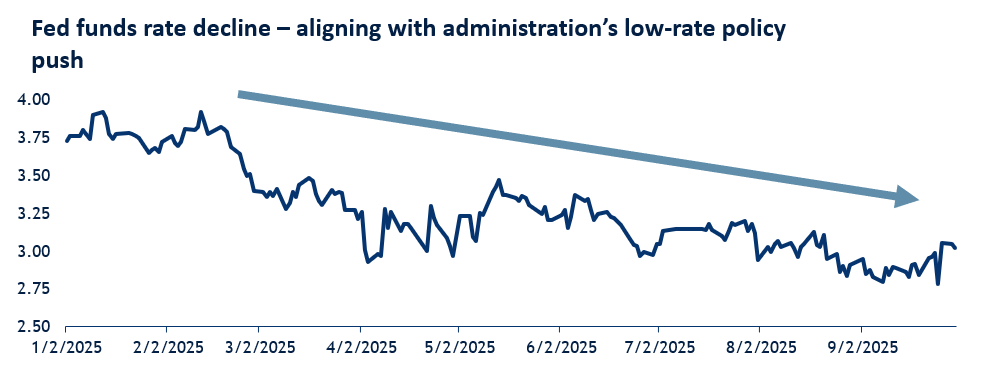
THE FED IS BACK IN THE GAME
Fed easing cycle is a tailwind for risk assets.
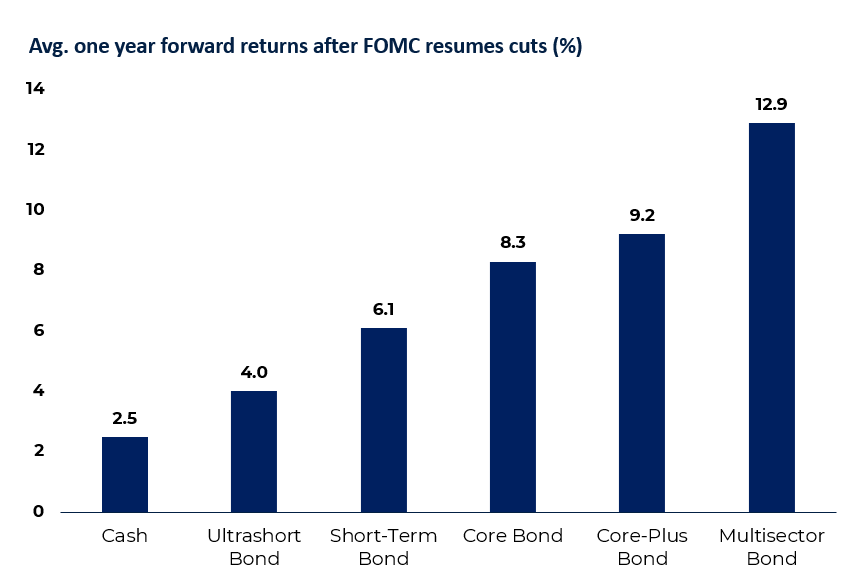
The Fed has resumed its easing cycle after a nine-month pause. Historically, Fed easing has supported risk assets – provided a recession does not follow shortly thereafter. Given our outlook for continued economic growth, we believe this cycle could offer incremental support to markets, particularly in large-cap equities and across multi-sector, core-plus, and core bond segments within fixed income.
Source: Blackrock, Bespoke, Bloomberg, as of 09/30/25
WHAT’S NEXT?
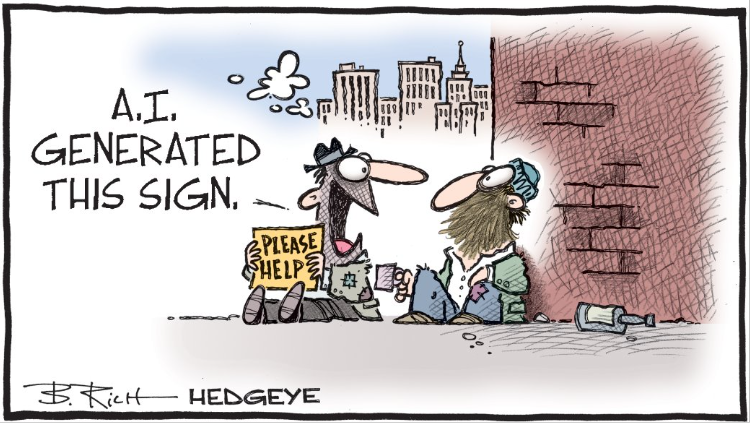
Source: Robert Rich, Hedgeye Risk Management, 2025
IMPORTANT DISCOLSURES
OpenArc Corporate Advisory, LLC, (“OpenArc”) is a registered investment adviser with the Securities and Exchange Commission. This material is presented for informational purposes only and should not be construed as an attempt to sell or solicit any products or services of OpenArc nor should it be construed as legal, accounting, tax or other professional advice. Past performance of model performance shown is no guarantee of future results. The model portfolio performance does not reflect actual trading or any advisory, management, or transaction fees, all of which could result in substantially lower results. This does not reflect the impact that material economic and market factors may have had on decision making. You cannot invest directly in an index.
This investment strategy is based on a model portfolio developed by Dynasty Wealth Management, LLC (“Model provider”), a registered investment adviser with the Securities and Exchange Commission. OpenArc retains full discretion over the implementation, customization, and management of client accounts using this model. The Model provider does not manage client accounts, does not provide individualized investment advice, and is not responsible for investment decisions, performance outcomes, or suitability determinations. The Model provider receives compensation from the underlying investments. Outsourcing costs range from 2 – 4 bps (program fee) and can be discounted based on assets under management. Outsourcing includes investment management, trading, billing, and communications. This fee will be absorbed by OpenArc.
Performance data does not reflect the deduction of advisory fees or any other expenses clients may incur in the management of their advisory account, which will result in a reduction of client’s returns. It is the responsibility of OpenArc to disclose the advisory fees charged and how it affects the returns shown in this document. Additionally, the effect of income taxes is not shown. The performance reflects reinvestment of dividends and interest, as applicable.
This material does not take into consideration an investor’s specific investment objectives or risk tolerance. Performance analysis is based on information provided by Morningstar, or other third parties. The information contained in this presentation has been gathered from sources we believe to be reliable, but we do not guarantee the accuracy or completeness of such information, and we assume no liability for damages resulting from or arising out of the use of such information.
Historical performance results for investment indices and/or product benchmarks have been provided for general comparison purposes only, and do not include the charges that might be incurred in an actual portfolio, such as transaction and/or custodial charges, investment management fees, or other fees applicable to the account, all of which could result in substantially lower results. It should not be assumed that your account holdings correspond directly to any comparative indices.
The information presented does not reflect the impact of taxes on non-qualified accounts. Any tax considerations do not constitute tax advice and are not intended to be used to avoid federal, state or local income tax, or related tax liability. We do not provide legal, accounting or tax advice. You are encouraged to discuss the tax and legal implications of any transactions contemplated with a professional legal, accounting or tax advisor.